Wednesday, 22 October 2014

Git add, commit, push – Github

My first experience using GitHub was met with a sea of confusion. "GitHub is a Git repository web-based hosting service, which offers all of the distributed revision control and source code management (SCM) functionality of Git as well as adding its own features" [1]. It's used by my MOOCs for grade assessment. Students upload completed assignment files (such as code text documents and images) to GitHub, made available for viewing by other students. I submitted an assignment for the Reproducible Research course and pleasantly discovered that the GitHib submission went smoothly. This was largely due to recalling I needed to be in the right directory. The following are the steps I took to submit my work to GitHub. I have assumed the reader has set up a GitHub account and has installed Git Bash on their Windows machine [2].

First I was instructed to "fork" a repository. I need to define some terms here. A repository is "a central location in which data is stored and managed" [1]. "A fork is a copy of a repository. Forking a repository allows you to freely experiment with changes without affecting the original project" [3]. I won't go into the details, but to fork a repository, you follow the GitHub link to the repo (that's what the cool kids call it) and click on "Fork". That's it. The forked repo appears in your list of repositories. The contents of the forked repo are available to you to view. But you are not ready to make changes to the contents of these files and make these changes available to others. In order to do that, a local copy of the repo is required on your computer. In other words, the repo and its contents need to sit in a directory on your computer. The local copy and the repo on GitHub are linked. Changes made to the local copy can be synced with GitHib.

To make a local copy of a repo, you need to clone the repo.

Opening Git Bash [4] I typed "git clone" [5], space then a URL. The URL points to the forked repo (called "RepData_PeerAssessment1"). My username on Git is "DataMoose".


After hitting Enter, the repo appears in my Home directory, as seen below with the folder called "RepData_PeerAssessment1".


When I open the folder I can view the contents. Note that there exists a "PA1_temlpate.Rmd" file. Later I will overwrite this file.


I stated that knowing what directory I was in was for smoother sailing. To check the current directory, type "pwd" (which stands for "print working directory").


I'm in my Home directory at C/Users/Karim [6]. I need to change the directory and point to the repo on my machine. Changing directories is achieved by type "cd" followed by a space, then the folder name (that exists in the current directory) I wish to jump into. Hit Enter.


As a sanity check, type "pwd" again to confirm you are now in the desired directory. A very useful thing to type to get a feel for this directory is "git status" [7]. This returned a status on whether any files in the repo had been modified.


Upon completing my assignment, three files ("PA1_template.Rmd", "PA1_template.html", "PA1_template.md") and a folder ("PA1_template_files") contained figures were produced. I copied then pasted the files and folder into my local repo folder, overwriting the "PA1_temlpate.Rmd" file.

Typing "git add ." will add any new or changed files to git. One can add a specific file by typing out the filename. Use of "." Will add all files in the directory.

Typing "git commit –m" will, I suppose, commit the additions. I'm assuming this step is equivalent to asking "Are you sure you wish to continue?". The "first commit" is my choice of statement. I could write anything and it will display on GitHub. After hitting Enter, the files that are added/committed are listed.


Typing "git push –u origin master" then hitting Enter will prompt for your GitHub username and password. After (correctly) keying these in, stuff (hopefully) appears to indicate that the files have been added to the repo on GitHub.


Refreshing your GitHub repo list, you will see that the new/changed files have appeared (those with "first commit").


That's how we fork, clone, add, commit, push with Git. GitHub is a fantastic (free) tool for version control of your work. In the event you made a blunder, you can rollback to prior versions of files. For my purposes, students can hopefully award me full grades for my assignment.


References and notes
1. I Googled this.
2. I haven’t really assumed this. I'm quite aware people use Macs. I'm a PC, and I wear glasses.
3. Help from: https://help.github.com/articles/fork-a-repo/
4. Allow me a moment to get all colloquial on your ass. Git Bash is an interface that lets me type in single line commands that gets the computer to do stuff, OK? OK!
5. As guided by: https://help.github.com/articles/fork-a-repo/
6. My name is Karim. Nice to meet you.
7. I was guided by: http://guides.railsgirls.com/github/

Sunday, 12 October 2014

Screenshots – Snipping Tool

The Programming for Everybody course is already paying off – I learnt a new way to take screenshots.

In one of the lectures, the Snipping Tool is used to take screenshots (for Windows). I've been using it for years to box out a region and capture the image. Sure beats using the PrntScr key exclusively.

About a year ago a colleague pointed out the Screenshot option in MS Word 2010 in the Insert tab. This allows you to get the image of an open window without having to use the Snipping Tool by drawing the box around the window.


I use the Snipping Tool to grab images that are not encased in a window per se. I draw my box and readjust until it looks right. I get really picky about it – I like my screen grabs to be neat. Same border width all 'round I say. However I did not know that I had options with the Snipping Tool. The default is "Rectangula'Snip". Selecting "Window Snip" allows you to select any open window to take the screenshot, including (it turns out) an image on my VLC media player.


If there are two overlapping windows, you can select the background window and Snipping Tool will include the foreground image snipped out via the background border. Did that make sense? Here's a picture of two over lapping Word documents.

Using Windows Snip and selecting the background, we see that part of the foreground is included.


It goes to show that even when you've been using something for a long time, there's still more that can be achieved.

Sunday, 28 September 2014

Word clouds using the wordcloud package – R

Everyone loves word clouds. But how do you create them? Thankfully, there is an R package for the purpose, called “wordcloud”.

First, I needed to install the wordcloud and the text mining (tm) packages. The RColorBrewer package is required (if you don’t have it already).


I need a bunch of words. I've always liked the introduction speech that V makes in V for Vendetta [1]. I set the words as a character.


I would like to restrict the word cloud to v-words only. There are a number of steps required to present only v words.


  • The string is split up into separate words as a data frame. Remember, a data frame is "a table, or two-dimensional array-like structure, in which each column contains measurements on one variable, and each row contains one case".
  • Get the row numbers of the data frame containing words that start with v. This is achieved by use of metacharacters ^[Vv] which will search for the start of each word with either an upper or lower case v.
  • Use the row numbers to subset the words from the data frame. That is, the non v words are excluded.
  • Some of these v words end with punctuation marks like full stops and commas. These are removed using the gsub() function and metacharacters [[:punct:]].
  • The remaining text of v words free of punctuation are fed into the wordcloud function with parameters defining the size of the text and colours.

Coolness - I have my v words as a word cloud. However this isn't a particularly exciting word cloud since each word only appears once, thus the text are the same size and colours. Let's try the following quote (spoilers!) from Walter White in Breaking Bad [2].


Looking at the quote we can see that the words "I" and "you" occur a number of times. Let's run some code and produce the wordcloud.


Great, but I cannot see the "I" and "you". Such "stop words" are not included by default when using wordcloud. Also notice that "Skyler"  and "NASDAQ" are lower case. Further, the apostrophe has been removed from "you're". 

What if I wished to include all words from the quote, adjust the capitals and keep the apostrophes? Starting again with the quote (bb – highlight and run it again), the following code is run [3].


After running the first nine lines, the quote looks like the below. 


The code takes the character string, splits it into separate words, counts the frequency of each word, sorts the matrix, creates a data frame that is fed into the workcloud function to produce the word cloud.


Done! All words are present. One could remove the stopwords from the quote by using the following. 


Then the code above (in the screengrab before the final Breaking Bad word cloud) can be run to generate a new wordcloud free of the common English words. Happy word clouding!


References and notes
1. Click here for a very excellent V for Vendetta kinetic typography of the speech.
2. If you have yet to watch Breaking Bad, DO NOT watch this spoiler.
3. The keen observers will have noticed bb <- stripWhitespace(bb) as the first line. This command takes the character quote and removed any spaces (such as those created by using tab). This line is required, otherwise the frequency table will tally these white spaces and distort the wordcloud.

Sunday, 17 August 2014

Read in multiple files across different directories – R

Here is the scenario. I have a folder "Data folder" which contains two folders, "First files" and "Second files". Within "First files" are three text files, "File 1", "File 2" and "File 3" (seen below). Within "Second files" are three more text files, "File 4", "File 5" and "File 6".


The contents in the files do not really matter. My objective was to write code that could read in the contents of each file (all six) for further data manipulation in programming software. Let's start moving away from Excel VBA and towards programming with R.

Here is the code. Lines that start with # are comments.


The directories for the Data folder, First files and Second files are established. Then, two for loops iterate across the directories and files to read data into the workspace. These are the steps of the for loops:
  • myDir specifies the two directories ("First files" and "Second files").
  • for (directory in myDir) starts the directory loop.
  • setwd(directory) points to the first directory ("First files").
  • myFiles is the list of filenames in the current directory ("File 1", "File 2" and "File 3").
  • for (filename in myFiles) starts the filename loop.
  • filepath is the filepath that points to an individual file (first is "File 1").
  • dataTemp is the data frame that contains the data read in from the file. A "data frame" is used for storing data tables. Now you know.
  • cbind(assign(filename, dataTemp)) will assign the name of the file ("File 1") to the dataTemp. In this way, each file that is read in is named by the filename automatically. In other words, when "File 1" is read into the workspace, the data frame name is "File 1.txt".
  • The next file in the loop is "File 2". Then "File 3".
  • Then the second directory is selected ("Second files"). Within this directory, the three files "File 4", "File 5" and "File 6" are read in.
The end result is six data frames with the same name as the files [1].


This example pointed to two directories. Within each directory there are three files (six in total). This code can be scaled up and down – I could have a hundred directories with a hundred files in each. Cheers for automation!  


References and notes
1. I use RStudio to make life easier with R. I can see my R Script on the left. The Console which spits out the results of code execution on the top right. And the Environment which shows the data and values created upon code execution.

Sunday, 3 August 2014

Visual display with pivot tables – Excel VBA

The example I use here is terribly simple. Yet a collection of simple techniques can create complexity. Let's colour in data from a pivot table using VBA code. I have the dates of when Breaking Bad episodes aired in the States [1]. I want to see, via a calendar-style display, when these episodes aired over the years of sheer television awesomeness.

Here is the data. The text in blue is text I modified or created. The dates from Wikipedia had to be reformatted to DD/MM/YYYY format. I then used the =Year(), =Month() and =CONCATENATE() formula to get the dates into Year-Month format.


I selected all of the data and created a pivot table (Insert tab, then "PivotTable"). On the right hand "PivotTable Field List" panel, I dragged in "No. in series" under “Column Labels, dragged in "Year-Month" under "Row Labels" and selected the Count of No. in series under "Values". You will see the episode series numbers 1 to 62 across the columns, and the Year-Month down the rows. The "1" in the cells indicate that the respective episode aired on the row's Year-Month.


To get a better representation of time, I included the Year-Months that did not air a Breaking Bad episode by inserting rows. These are shown in blue.


Next, I prettied things up. Added headers for the seasons and Year-Months, and included grid lines. I narrowed the column widths to make square cells. Notice that going down the rows, for each year there are twelve cells (January to December).


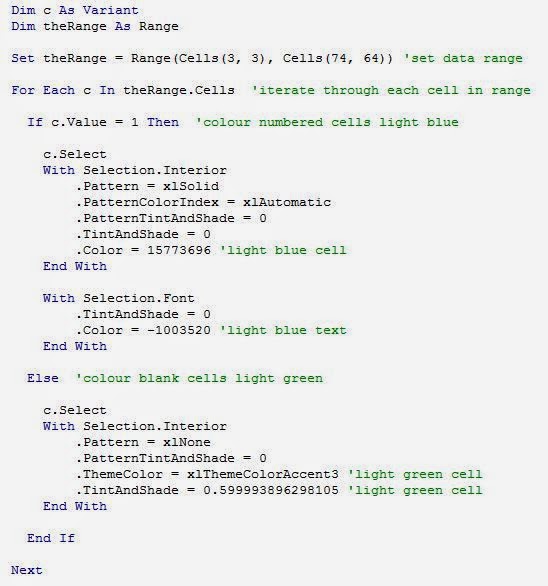
Now for some colour. I want the cells with "1" to be blue, and the blank cells to be green. Since there are few cells with 1, I could simple highlight all cells green then colour the 1 cells blue (and change the "1" text colour to the same blue). That's fine for a one-off, but I intend to repeat the process again, thus I wrote code.


I'll point out some features. Set theRange = Range(Cells(3, 3), Cells(74, 64)) sets the range of cells in the grid that the code will focus on [2]. For Each c In theRange.Cells will point the code to iterate through each cell in the range and do something. That something is colour blue if the cell contains "1", or colour green if the cell in blank. There are three sections that are enclosed with "With" and "End With". The first will turn the cell blue. The second will turn the text colour blue. That last will turn the cell green. After running the code, we get the following.


What is clear from this display is that there simply wasn't enough Breaking Bad episodes. Maybe I'm just sad that there will be no more. I do have the minisodes to watch. And there's Better Call Saul, so yeah!

You may be thinking, what was the point of this display? It's doesn't show that much. This approach may be useful for other purposes. I have used this approach to indicate events over time, such as attendance at a venue or receipt of a service. Provided that the data contains dates, conversion to Year-Month format then use of the pivot table will create the grid structure. The code is to automate the colouring. In my example .Color = 15773696 is light blue cells and .Color = -1003520 is light blue text. .ThemeColor = xlThemeColorAccent3 and .TintAndShade = 0.599993896298105 is for light green colouring. To get the codes for different colours, turn on the "Record Macro" feature (Developer tab), select the desired colour, stop the recorder and take a look at the macro produced for the respective codes for colour to copy and paste into your code.

My pivot table only contains one number. With a variety of numbers, one can apply Conditional Formatting (Home tab) to get various shades of colour. Darker shades indicate higher numbers. One could produce something like this display, yet I don't know what software was used to produce it [3].


Excel is great for simple visual displays, but I am exploring alternatives. I'll start with R and will let you know how it goes.


References and notes
1. Data from Breaking Bad Episodes Wiki page.
2. I hard-coded the cell position numbers for this particular dataset. One can set the code to use relative cell positions.
3. I came across the display via this Reddit thread. It was produced by Project Tycho. The original image was modified by user FortyFs, which I used in this post.

Sunday, 20 July 2014

Call a procedure to get the first empty column number – Excel VBA

You have a spreadsheet and you want to add some data in the first empty column. How do you know which column to use? You simply use your eyes and look. Guide your mouse to move the cursor to a cell in the empty column, enter a formula, then autofill down. But how does one automate this for a spreadsheet when you do not know beforehand which column is empty (eg column B, column AB, etc)? Your computer does not have eyes to simply check.

Or does it?

A webcam is an eye, but your webcam will not assist you with automation. It will assist you with a fine evening on Chatroulette.


Below is code to determine the location of the first empty column in a spreadsheet. As a bonus, it includes code that will determine the last row where data exists on the spreadsheet [1].


Take the following sheet which holds episode details of Breaking Bad season 1 [2].


After running the code, it returns the next empty column (emptyCol) as column 5 (column E), and the last row with data as row 8. 

Now I want to populate column 5 (column E) with data. Using the Original air date, I want to list the year. I can use something like this:

Range(Cells(2, emptyCol), Cells(rowLast, emptyCol)).Formula = "=Year(Originalairdate)"

Where emptyCol = 5, rowLast = 8. The “Range(Cells(), Cells())” part are the coordinates of the range where I wish to populate cells: from rows 2 to 8, restricted to column 5. I have used the year formula on the data in the “Original air date” column [3]. 


Next scenario. What happens when you have to repeat this action? I now want to have a column with the month of the original air date (using the Month() formula), and then populate the next empty column with the day (using the Day() formula). This would be populated in column F and G respectively. Before populating data in the next empty column, the software needs to know where the empty column is. Like this:
  • Find the column number of the next empty column
  • Remember the column number
  • Point to empty column using the remembered column number
  • Populate with data (eg year)
  • Find the column number of the next empty column
  • Remember the column number
  • Point to empty column using the remembered column number
  • Populate with data (eg month)
  • Find the column number of the next empty column
  • Remember the column number
  • Point to empty column using the remembered column number
  • Populate with data (eg day).


Each time a column is populated with data, the empty column number changes by one (year in column 5, month in column 6, day in column 7). You could copy and paste the whole code each time to get the next empty column (and last row with data if this changes). Or, you could set the code aside in a procedure. When you need to run the code, call the procedure. Here I have placed the code in a procedure called "EmptyCol_LastRow". 


I can call this procedure (EmptyCol_LastRow) as required to get the new emptyCol values, as follows:
  • Call procedure to get emptyCol and lastRow
    • emptyCol = 8, lastRow = 8
  • Populate with year
    • In column 8 
  • Call procedure to get emptyCol and lastRow
    • emptyCol = 9, lastRow = 8
  • Populate with month
    • In column 9
  • Call procedure to get emptyCol and lastRow
    • emptyCol = 10, lastRow = 8
  • Populate with day
    • In column 10.
The corresponding code that populates the columns with data is shown below.


Rather than copy paste lines of code to get updated column and row numbers, simply call the procedure as required!


References and notes
1. Code modified from ozgrid.com VBA/ExcelRanges page. 
2. Data from Breaking Bad Episodes Wiki page.
3. I manually created a named range for the Original air date column called “Originalairdate”.

Sunday, 13 July 2014

Online R programming course

If I had my time again, I would have taken a gap year before commencing University. Rather than travel the world whilst supporting myself working data entry jobs in windowless offices, I would be particularly nerdy and enrol in a whole bunch of free online courses.

There were very few structured online courses back at the turn of the century. Google was barely a thing.

I didn't know what I wanted to do at University at the age of 17. Yet whilst completing my final year exams, I filled out my list of preferred degrees informed by short blurbs from a phone book-thick course guide. I ended up in a molecular biology/genetics/biochemistry degree and proceeded to hate if for the three year duration. Good choice me [1].

The availability of massive open online courses (MOOCs) allows me to say, "Hey, what's a course in Marine Biology like?", then find one and enrol. In the comfort of my home, I watch videos, attempt quizzes and submit assignments. If I don't understand any of the course content, I can engage with other student on discussion forums [2].

I enrolled and completed two Coursera courses to date: The Data Scientist's Toolbox and R Programming. The courses are really well-structured and the range of topics covered have been broad. R programming included the following:
  • Data types
  • Subsetting
  • Reading and writing data
  • Control structures
  • Functions
  • Scoping rules
  • Vectorized operations
  • Debugging.

Course assignments drove the requirement to learn programming in R. One assignment provided hospital mortality data from hundreds of hospitals across the United States. The assignment was to write a function whereby users could enter the name of a US State and request a list that ranked the best (lowest mortality) or worst hospitals (higher mortality). Since I have programming experience, I could list the logical steps required to fulfil the task: 
  • Read the spreadsheet data
  • Point to the State and mortality columns
  • Get the user's input parameters (State and rank request)
  • Organise the data as specified by the user's parameters (subsetting and sorting)
  • Return the result as a list.

I do know how to code the logical steps via VBA in Excel. However the assignment required coding in R. I had to learn the R syntax required for each step. That is, I had to correctly use the R syntax for a For loop, for an If Else statement, etc. The screen-grab shows a simple For loop with an If Else statement as written in VBA (background) and R (foreground using the R Studio IDE). One step at a time, putting it all together, I had a functioning function.


Different programming languages can all perform the same basic tasks (I assume). Efficiency, tools and packages, time, usability, cost, experience, popularity – such factors influence the choice of a programming language. I can see where I would use R for some projects at work over VBA. Then I can enter the debate of whether one should use SAS/SPSS/Python/R for business needs. I think the first two have a greater market share. However the last two are open source and have a dedicated users with various Meetup groups. For now, I'm happy to sample different programming languages via MOOCs. But life still owes me a gap year.


References and notes
1. I believe that it is a tad bit unfair for a 17 or 18 year old to make a choice that significantly dictates the course of one's career for (most of) life. I had had very few major life experiences at 17; I was living at home, was not working, had barely travelled, and only knew how to make plain omelettes and cheese pizzas. 
2. A disadvantage to "real life" courses is the lack of direct access to lecturers and tutors. Recognition of qualifications upon completing an online course is under development.