Previous post in this series:
Fitbit 01 – Getting and wrangling weight, steps and calories burned data.
Let’s continue to get and wrangle Fitbit data. This post will tackle sleep data and address my unattractive trait of not easily letting things go.
I applied the following R package
fitbitScraper function wrapped in a data frame:
dfSleep <- as.data.frame(get_sleep_data(cookie, start_date = startDate, end_date = endDate))
There’s a lot of data. Below is the list of columns I want to keep:
- df.startDateTime – The start datetime of sleep.
- df.endDateTime – The end datetime of sleep.
- df.sleepDuration – The minutes between the start and end time. df.sleepDuration = df.awakeDuration + df.restlessDuration + df.minAsleep".
- df.awakeDuration – The minutes of wakefulness.
- df.restlessDuration – The minutes of restlessness.
- df.minAsleep – The minutes of actual sleep. I want to maximise this data field. More sleep less grumpiness.
If you’re a normalish human being, you would look at the sleep data and examine it for any anomalies. Your keen eye will note that some sleep durations are split across two or more sessions. That is, you went to bed, woke up in the middle of the night, then fell asleep again. Depending on how long you were awake for, Fitbit will record separate sessions.
I am working towards a tidy dataset with each row representing a unique date with the day’s Fitbit data. Separate sleep sessions cause duplicate dates. Being a normalish human being, you write code that will group the split sleep sessions back together. Unique dates per sleep lends to tidy data.
If you’re not a normal human being, you examine the intricate nature of these split sleep sessions and spend way too much time writing code that groups the data back together.
I am not a normal human being.
Split sessions occur for two reasons. The first occurs when I wake up in the early hours of the morning. An example is below.
On the night of the 22nd March I fell asleep at
23:37. I woke up at 3:49 on the 23rd. After hating my life and eating
morning chocolate, I finally fell asleep again at 4:51. Technically the second
session date should be displayed as the 23rd of March, not the 22nd.
These display dates are akin to the “date I tried to fall asleep”. The
datetimes record the true date and times.
When I combine these separate sessions, the new sleep start
time will be 23:37 and the new sleep end time will be 07:46. The SleepDuration,
SleepAwakeDuration, SleepRestlessDuration, SleepMinAsleep, SleepAwakeCount and
SleepRestlessCount values will be summed together. I would also like to note
the number of minutes I spent awake between sessions and the number of separate
sessions (two in this example).
The second split sleep session type appears to be a glitch with
sessions being separated by a difference of one minute. An example is below.
On the 23rd of February I have sleep sessions ending
at 03:47 then resuming at 03:38. There are multiple instances where this occurs
in my datasets. As before, the sleep variables from both sessions will be
summed. I don’t need to note the minutes between the sessions as the one minute
difference is meaningless. Further, the number of sleep sessions should be
recorded as one, not two.
There’s a final consideration with split sleep sessions. Consider the below.

According this this display, on the 8th April I slept from 22:23 to 5:27, then on the 21:06 to the 23:57 on the same day. No I didn’t! The sleep session datetimes are overlapping. The session displayed on the 8th April from 21:06 to 23:57 should read the 9th April, not the 8th. This session needs to be combined with the sessions displayed on the 9th April from the 23:58 to 6:03. I may not be a normal human being, but I have my limits. For this last case, I did not write a patch of code that could group the data appropriately. Since there were few instances when such overlapping sessions occurred, I let it go – such sessions were removed from the dataset resulting in missing sleep data for that particular date.
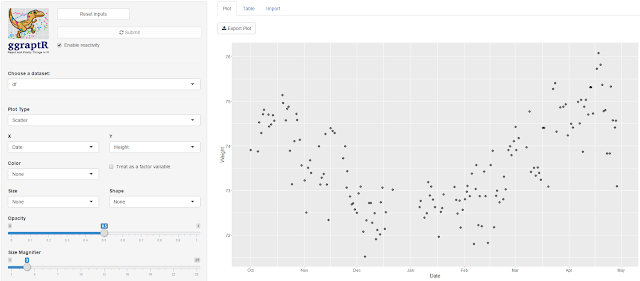
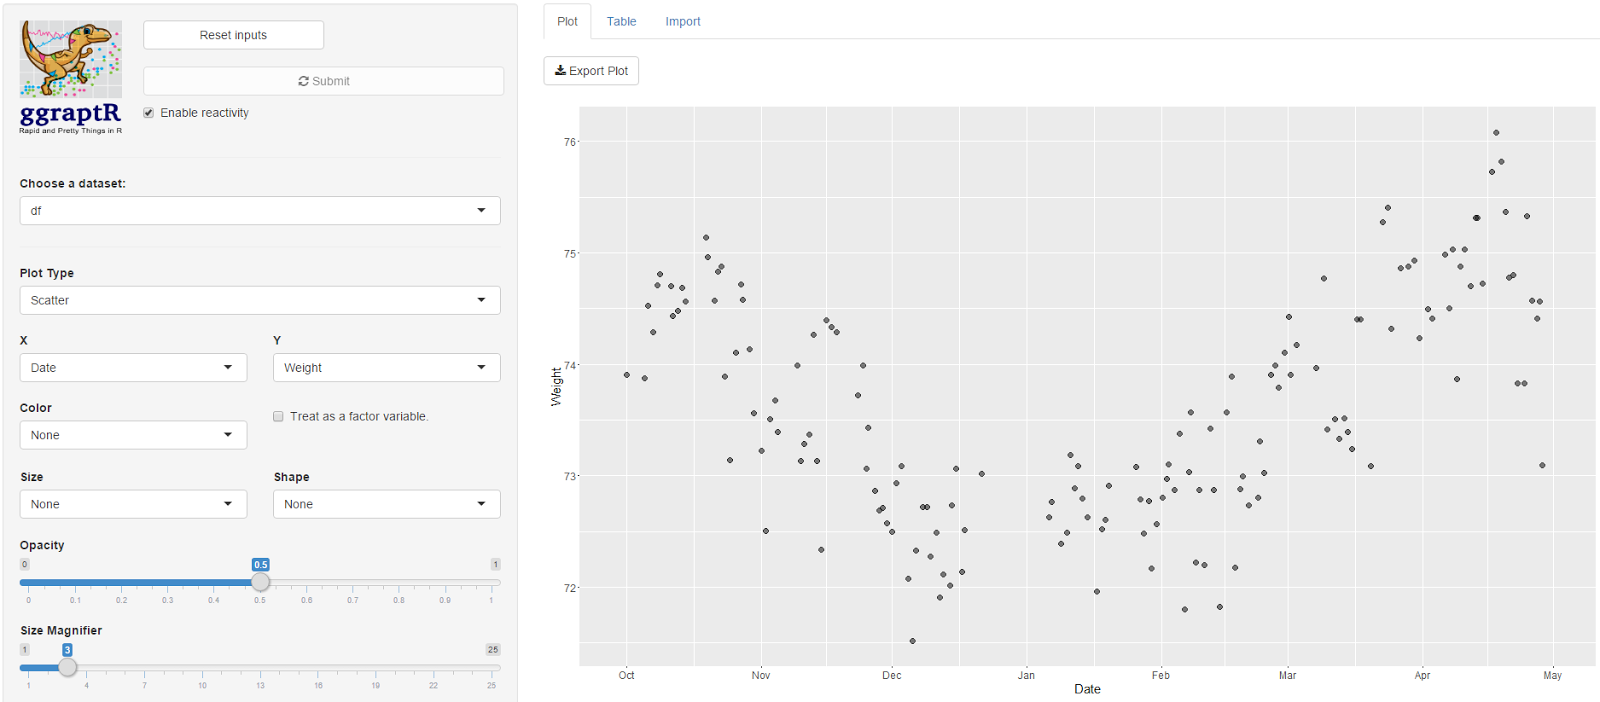
Here is a quick plot of the average number of minutes asleep
per weekday. Nothing out of the ordinary. I sleep an average 7.6 hours on
Sunday nights and an average 6.4 hours on Wednesday nights. I can’t think of a
reason why I get fewer hours on a Wednesday night.
I spend most of my time wrangling data. I come across
problems in datasets as described above often, and write code to return the
numbers back to reality as much as possible. When the costs (time and effort) outweigh
the benefits (more clean data) I have to let some data go and remove it.
I have outlined the code at the end of this post for the
avid reader.
#### Sleep

    ### Get data

        dfSleep <- as.data.frame(get_sleep_data(cookie, start_date = startDate, end_date = endDate))


    ### Keep key columns

        dfSleep <- dfSleep[ , c("df.date", "df.startDateTime", "df.endDateTime", "df.sleepDuration", "df.awakeDuration",
                                "df.restlessDuration", "df.minAsleep")]

        ## Rename colnames
        # Date is sleep date attempt
        colnames(dfSleep) <- c("Date","SleepStartDatetime", "SleepEndDatetime", "SleepDuration",
                               "SleepAwakeDuration", "SleepRestlessDuration", "SleepMinAsleep")


    ### Combine the split sleep sessions

        ## Index the Dates that are duplicated along with their original
        duplicatedDates <- unique(dfSleep$Date[which(duplicated(dfSleep$Date))])
        dfSleep$Combine <- ""
        dfSleep$Combine[which(dfSleep$Date %in% duplicatedDates)] <-
            dfSleep$Date[which(dfSleep$Date %in% duplicatedDates)]

        ## Subset the combine indexed rows
        dfSubset <- dfSleep[which(dfSleep$Combine != ""), ]

        ## Aggregate rows marked to combine
        dfSubset <-
            dfSubset %>%
            group_by(Combine) %>%
            summarise(Date = unique(Date),
                      SleepStartDatetime = min(SleepStartDatetime), # Earliest datetime
                      SleepEndDatetime = max(SleepEndDatetime), # Latest datetime
                      SleepDuration = sum(SleepDuration),
                      SleepAwakeDuration = sum(SleepAwakeDuration),
                      SleepRestlessDuration = sum(SleepRestlessDuration),
                      SleepMinAsleep = sum(SleepMinAsleep),
                      SleepSessions = n() # Number of split sleep sessions
            )


    ### Get the minutes awake between split sessions

        ## Calculate sleep duration using start and end time using floor (round down)
        dfSubset$AwakeBetweenDuration <- floor((as.POSIXct(dfSubset$SleepEndDatetime) - as.POSIXct(dfSubset$SleepStartDatetime)) * 60)
        dfSubset$AwakeBetweenDuration <- dfSubset$AwakeBetweenDuration - dfSubset$SleepDuration

        ## Set any duration less than five minutes to zero
        dfSubset$AwakeBetweenDuration[which(dfSubset$AwakeBetweenDuration < 5)] <- 0


    ### Remove rows of combined sleep sessions

        ## Remove any row with AwakenBetweenDuration greater than five hours
        dfSubset <- dfSubset[-which(dfSubset$AwakeBetweenDuration > 60*5), ]


    ### Replace split sessions in dfSleep with dfSubset

        ## Prepare dfSubset for merging

        ## Remove duplicate dates from dfSleep
        dfSleep <- dfSleep[-which(nchar(dfSleep$Combine) > 0), ]

        ## Add new columns
        dfSleep$SleepSessions <- 1
        dfSleep$AwakeBetweenDuration <- 0

        ## Remove Combine column
        dfSubset <- dfSubset[ , -which(colnames(dfSubset) == "Combine")]
        dfSleep <- dfSleep[ , -which(colnames(dfSleep) == "Combine")]

        ## Bind dfSubset
        dfSleep <- rbind.data.frame(dfSleep, dfSubset)


    ### Coerce as date

        dfSleep$Date <- as.Date(dfSleep$Date)